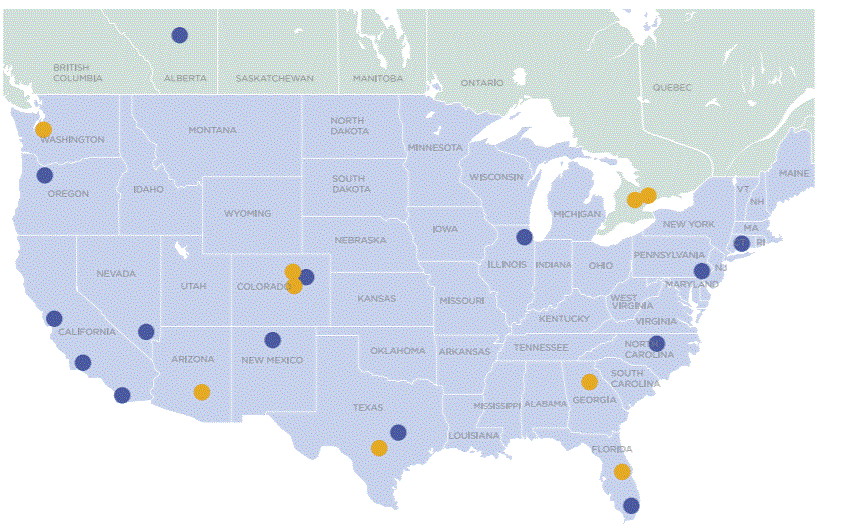
In 2016, a new water use study of approximately 1,000 single-family homes was published, highlighting water use across the U.S. and Canada. This study was based on consumption data from 23,749 homes provided by 23 participating utilities. Corresponding surveys were obtained from 4,643 single-family residences. Then, in nine of the utilities (shown with yellow dots on map below), 900 homes were selected for additional end-use sampling.
A similar study was published in 1999 (REU1999), but the 2016 study (REU2016) includes more varied study site locations, hot-water usage data, more detailed landscape analysis, and additional water rate analysis. Overall, the 2016 study showed a 22 percent reduction since the last similar study was published in 1999. Mandated reductions in toilet flush and clothes washer volumes, and shower and faucet flow rates have contributed to the declines in residential water use.
Water usage study highlights
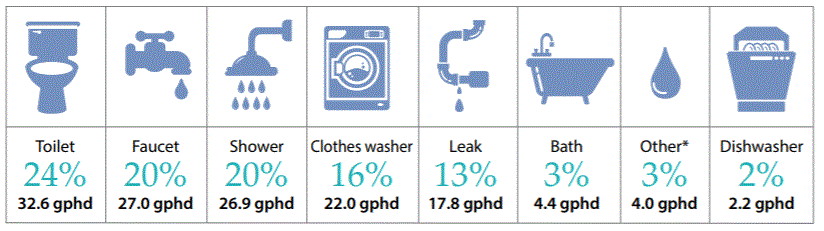
- Average annual per household water use ranged from 44,000 to 175,000 gallons per household per year (gphy). The large range in use reflects the strong influence of climate and weather patterns. Outdoor use is more variable than indoor use, and homes in warmer climates have higher outdoor use as they continue to irrigate in the winter.
- The median value for indoor water was 138 gallons per household per day (gphd). A sample of new homes built according to the EPA’s WaterSense New Home Specification Version 1.0 had an average daily per household water use of 110 gphd.
- The breakdown of water use is show in the diagram below:
Reduction from 1999 to 2016 highlights
- The biggest reduction in per capita water use between the two studies was measured in the clothes washer category due to efficiency improvements.
- The flush volume of toilets has decreased 29 percent, from 3.7 gallons per flush (REU1999) to 2.6 gallons per flush (REU2016). Toilet flushing frequency has remained the same — five flushes per person per day. In the 1999 study, just 5 percent of toilet flushes were 2.2 gallons per flush or less, compared to 37 percent of toilet flushes in the 2016 study.
- An automatic dishwasher was present in 84 percent of the 2016 study homes. The average water volume per dishwasher load decreased 39 percent, from 10 gallons per load (REU1999) to 6.1 gallons per load (REU2016). A comparison of households showed that if a house lacked a dishwasher, faucet use did not increase. Regardless of the presence of a dishwasher, faucet use averaged 26 gallons per household per day.
- The average daily per capita leakage decreased 17 percent, from 9.5 gallons per capita daily (REU1999) to 7.9 gallons per capita daily (REU2016). Thirty-two percent of homes had higher leakage rates, as high as 600 gallons per household per day.
- The 2016 study shows minimal change in showering patterns. The presence of children (aged 12 and under) increased bathtub use.
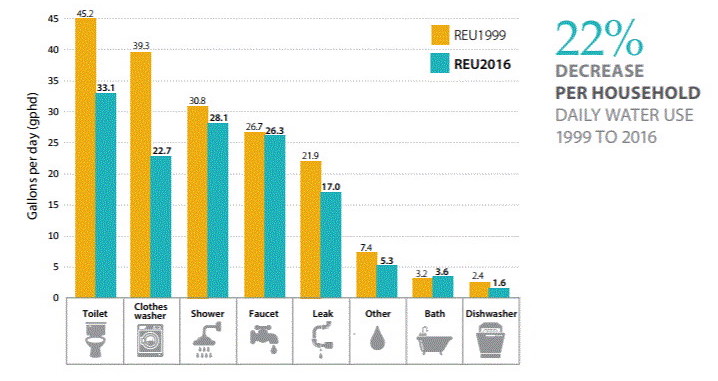
Average daily indoor per household water use in 1999 versus 2016.
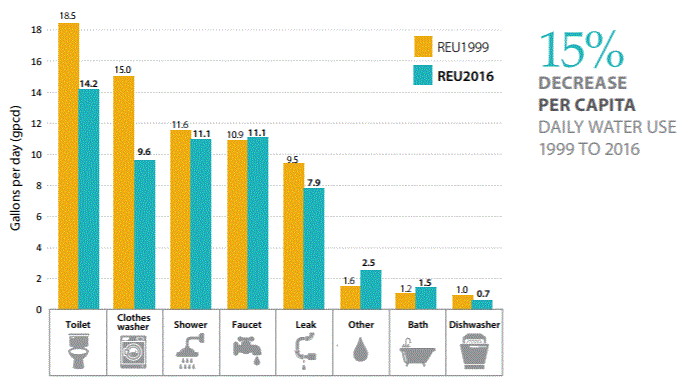
Average daily indoor per capita water use in 1999 versus 2016.
For the free "Executive Summary" see: www.circleofblue.org/wp-content/uploads/2016/04/WRF_REU2016.pdf.
Continue reading for free