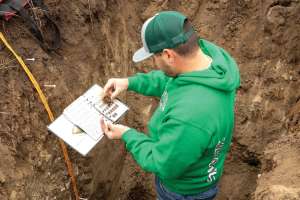
One key part of any site evaluation for location of a soil treatment area is the description of the soil profile. As we have stated many times, when we troubleshoot systems that are experiencing problems or have failed, the most frequent reason is a misinterpretation of the soil characteristics. There are two primary areas where mistakes occur: evaluation of structure and texture to estimate the long-term acceptance rate (LTAR) and not identifying features in the soil that indicate periodic soils saturation.
If you recall from past columns, soil characteristics used as evidence of periodic or seasonal saturation of soil layers are called redoximorphic features. These features are formed by processes of reduction, translocation and oxidation of iron and manganese oxides. When a soil horizon or layer is saturated there is a lack of oxygen and the iron and manganese compounds are reduced and will move into soil water solution, and move as the water moves in the soil.
As the soil dries and more oxygen moves into the soil, iron and manganese are oxidized. This results in unique patterns of color in the soil. Where iron and manganese have migrated away, the soils are gray in color (depletions), while the areas where they have reprecipitated are bright reddish or black in color (accumulations).
Naturally red color
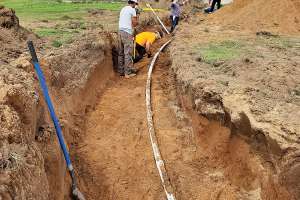
Wetland soil scientists use these same features to identify the presence and extent of wetlands for preservation and protection. We use the features primarily to set the separation distance between the infiltrative surface of the soil treatment component and the seasonally saturated layer. For example, if redoximorphic features are identified at a depth of 5 feet in the profile; and the minimum separation distance to a limiting soil layer required is three feet; the system can be excavated no more than 2 feet.
As with any indicator, there are always some problematic conditions or characteristics making identification of these features difficult. One condition prevalent in areas where we work is soils that have developed from a parent material that is naturally red in color due to the high concentrations of iron naturally present. In these soils, it is often difficult to see the depletions and accumulations due to the lack of contrast. The natural redness overwhelms the changes that occur during saturation.
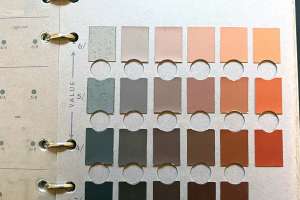
To determine color differences and contrasts, the Munsell color book is used. Munsell color notation is used, which identifies an overall hue along with a value and chroma. Soil matrix, depletions and accumulations are described. Redoximorphic features present are described by their abundance in terms of percentage of exposed surface, size and the contrast.
Abundance is described as few, common or many. Few are features that occupy less than 2% exposed area, common occupy 2-20% and many occupy more than 20%. Size is defined by fine medium or coarse; where fine is less than 5 mm, medium 5-15 mm and coarse greater than 15 mm. Five millimeters is approximately 3/16 inch and 15 mm is approximately 5/8 inch.
Contrast is defined by faint, distinct and prominent based on the difference in color notation. Faint is when the redoximorphic features are closely related to the matrix color; distinct the features differ by one or two hues and several units in chroma; and prominent the features and matrix vary by several units of hue, value and chroma.
For quick results
With this as background, we return to the difficulty in determining seasonal saturation in soils developed in red parent materials. The indicators for red soils (hue of 7.5 YR or redder) are as follows: the matrix has a value and chroma greater than two, and less than or equal to four. The layer must contain 10% or more depletions (common or many) and/or distinct or prominent accumulations. The depletions should differ in color by at least one value higher and one chroma lower than the matrix or a value of four or more and chroma of two or less.
Part of the guidance given to field soil scientists suggest that to be sure they are interpreting soil characteristics correctly, they determine the Color Change Propensity Index of a sample. Unfortunately, this index has required a soil sample be sent to a laboratory equipped to determine soil colors for analysis. This obviously takes time the site evaluator may not have to deliver their report to the client on a timely basis. As an aside, wetland soil scientists also run into the same issue relative to timing.
A few months ago, a field procedure was described in a scientific journal where this analysis can be done in the field in an hour using two test tubes and a series of reagents. The field method produced an accurate assessment 93% of the time. For soil scientists and others who describe soils for onsite sewage treatment system location in areas of predominantly red soils, this procedure can help cut down on the incidence of making the wrong soil call in terms of separation distance.
If you think this method would be helpful in your field evaluations, contact your University Extension or Natural Resources Conservation Service soil scientist to see if they are aware of the methodology and can help set up the procedure for your use.
Continue reading for free