Across the U.S. and Canada design flows for residential households vary significantly. What’s interesting is that even though we see flows as low as 90 to upwards of 200 gpd per bedroom, total indoor water usage does not generally vary significantly, so why do we see such a range? The varying regulatory approaches primarily relate to how much safety factor is included in the design flow.
To better understand these flows there are many items to consider. One of the most crucial factors is that design flows should be viewed as peak flows in onsite wastewater treatment systems. Maximum and minimum flows and instantaneous peak flow variations are various methods to calculate wastewater generally that should be considered when properly sizing and designing system components.
For many homes, most of the hydraulic load occurs over several short periods of time in the morning and the evening. The system must be capable of accepting and treating normal peak events without compromising performance or backing up. Peak events such as large gatherings will occur, and during these events the system must also perform.
Dissecting peak flow
The peak flow rate from a residential household is a function of the fixtures and appliances present.
The peak discharge rate from a given fixture or appliance is typically around 5 gpm with the exception of large bathtubs. The use of several fixtures or appliances simultaneously can increase the total flow rate above the rate for isolated fixtures or appliances. However, attenuation occurring in the residential drainage system tends to decrease peak flow rates observed in the sewer pipe leaving the residence. Although field data is limited, peak discharge rates from a single-family household of 5 to 10gpm can be expected.
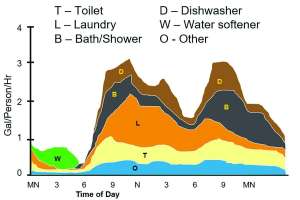
The image above shows how a municipal central sewer system influent varies throughout the day with the two main peaks in the morning as folks are preparing for school or work and in the evening when they prepare dinner, run the dishwasher or bathe. This municipal data never goes to zero, but with onsite wastewater treatment systems it is likely that there will be periods of no flow.
This variability in flow can affect gravity systems by potentially causing hydraulic overloads during peak flow conditions. Minimum hourly flows of zero are typical for residential households. Maximum hourly flows as high as 100 gallons are not unusual given the variability of typical fixture and appliance usage characteristics and residential water use demands.
Hourly flows exceeding this rate can occur in cases of plumbing fixture failure and appliance misuse such as a leaking toilet or faucets are left running. Wastewater flow can vary significantly from day to day, which can create challenges with some systems due to an inconsistent supply of food for bacteria within the system. Systems with time dosing can help mitigate some of these challenges. Most OWTS do not have flow equalization, so what comes in, goes out at the same rate.
Designing around peak flow
The average flows should be much less than peak flows for a system. Treatment systems are not designed to receive design peak flows every day.
There is a safety factor built into design flows that increases the life expectancy of systems and often increases the time needed between service visits. Safety factors are typically used to account for potential variability in wastewater characteristics at a particular household or establishment.
These predictions attempt to ensure adequate treatment by the OWTS without requiring actual analysis of the variability in flow or wastewater quality. However, actual measurement of wastewater flow and quality from a residential household always provides the most accurate estimate for sizing, designing and evaluating performance.

Meeting requirements
Using realistic flow estimates and safety factors to determine wastewater characteristics in order to design will result in the most cost effective OWTS that meets performance requirements.
Most onsite code requirements for system design of residential households call for estimating the flow on a per person or per bedroom basis. Codes typically specify design flows of 100 to 150 gpd per bedroom, or 50 to 75 gpd per person with occupancy rates of between one and one-half to two persons per bedroom. Since we want the system to work for a range of family sizes, the maximum occupancy is typically used.
For example, if an average daily flow of 75 gallons per person per day and an occupancy rate of two persons per bedroom were the selected design parameters, the flow prediction for a three-bedroom home would include a factor of safety of approximately two, when compared to typical conditions. In lieu of using conservative design flows, a direct factor of safety may be applied to estimate the design flow from a residence or nonresidential establishment. Multiplying the typical flow estimated by a safety factor of two yields a design flow of 280 gpd.
Ratios
Factors of safety used for individual systems will usually be higher than those used for larger systems of 10 homes or more. When more homes are connected the variability between household numbers and water generating practices are averaged out.
There is one item to consider with this typical regulatory approach, and that is as more people are in a household, the per-person usage goes down versus the linear approach that most regulations take. This may be due to the wider age range of people in households with more than four people and the sharing of water using activities such as dish washing and laundry. It is wise with normal residential homes to use a higher peak flow for the first two bedrooms but reduce that peak flow for additional bedrooms in the home.
Accounting for failures
Leaks are still a large challenge when it comes to wastewater generation. The last study done on this topic published in 2016 showed that 12.3% of our water usage is due to leaks and the average per capita leakage was 9.5 gpd per person, or 22 gpd per household. However, this value was the result of high leakage rates at a small percentage of homes with 67% of the homes in the study logging average leakage rates of less than 10 gpd. Of the study homes, 6% had leakage rates of more than 100 gpd.
Faulty toilet flapper valves and leaking faucets were the primary sources of leaks in these high-leakage-rate homes. Leakage rates like those measured in this study could significantly increase the hydraulic load to OWTS and impact performance. It is important that these large leaks be identified and corrected.
Hydraulic overloading is a frequent problem identified when troubleshooting OWTS and can be caused by wastewater flow or pollutant loads that exceed system design capacity. When more water is processed than an OWTS is designed to manage, detention time within the components is reduced, which can decrease pollutant removal in the tank and overload the soil treatment area. Reducing water use in a residence can decrease hydraulic loading to the treatment system and improve system performance.
As we have seen average design flows decrease there has been discussion about reducing code required peak flows in regulations. Care should be taken as the amount of contaminant as measured in mg/L of BOD, TSS, total nitrogen and phosphorus has conversely increased. Our onsite systems need to deal with the overall same amount of mass loading and therefore decreasing the flow value without accounting for these increased concentrations could impact system longevity.
Continue reading for free